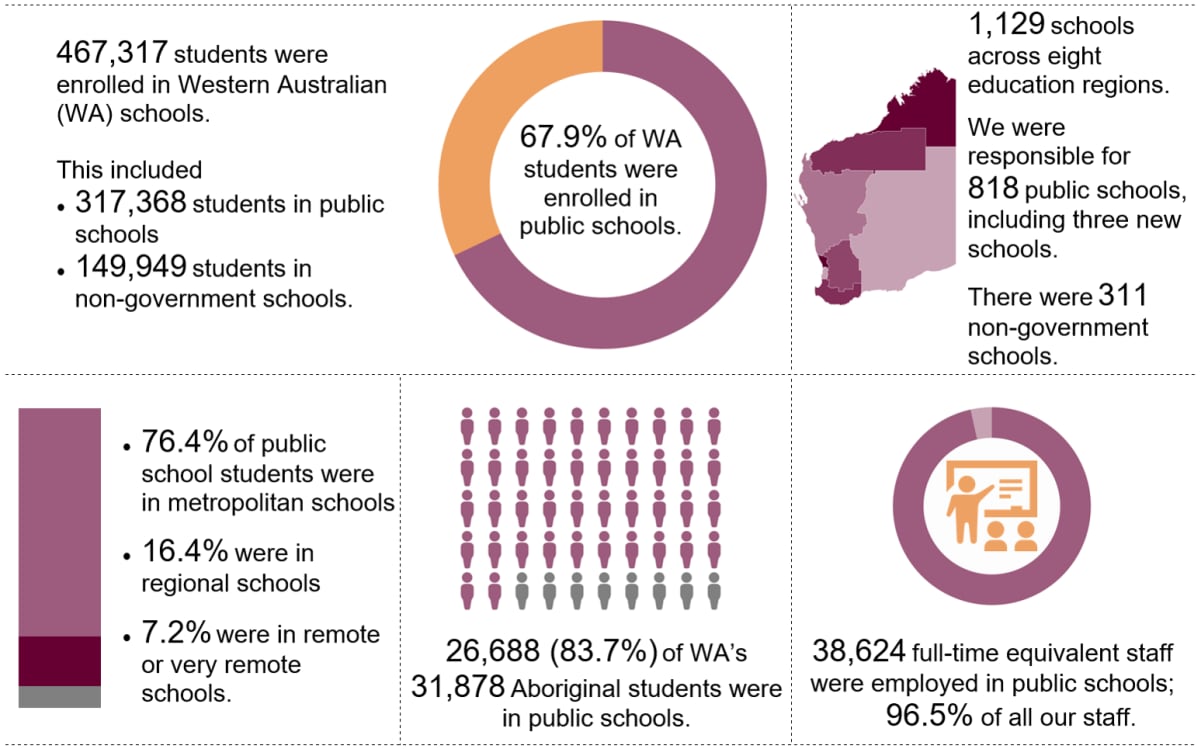
Our students and schools in 2020
See Appendix 1 for further enrolment data and Staff for further workforce data.
Year scorecard
We supported our Government Goal – Strong Communities: Safe communities and supported families – through our desired outcome ‘School students across Western Australia have access to high quality education’.
Key performance indicators helped us assess and monitor the extent to which we achieved this outcome and enhanced our ability to account to the community for our performance.
| Effectiveness indicators | Target (a) | Result |
|---|---|---|
| Rate of participation in education (proportion of persons aged 15 to 17 years in some form of education) | 97% | 97.8% |
| Retention in public schooling (proportion of Year 8 public school cohort studying in Year 12) | 82% | 81.6% |
| Western Australian Certificate of Education (WACE) achievement rate by Year 12 public school students | 81% | 80.7% |
| Year 3 public school students achieving proficiency in: | ||
| – Reading – Numeracy | 71% 70% | 68.8% 68.8% |
| Year 5 public school students achieving proficiency in: | ||
| – Reading – Numeracy | 69% 67% | 70.2% 66.1% |
| Year 7 public school students achieving proficiency in: | ||
| – Reading – Numeracy | 65% 63% | 67.3% 64.1% |
| Year 9 public school students achieving proficiency in: | ||
| – Reading – Numeracy | 72% 71% | 69.8% 67.8% |
(a) Targets for 2019–20 are as reported in the 2019–20 State Budget.
| Efficiency indicators | Target (a) | Result |
|---|---|---|
| Service 1: Public Primary Education | ||
| – Cost per student full-time equivalents | $15,582 | $16,207 |
| Service 2: Public Secondary Education | ||
| – Cost per student full-time equivalents | $19,018 | $19,094 |
| Service 3: Regulation and Non-Government Sector Assistance | ||
| – Cost of non-government school regulatory services per non‑government school | $7,841 | $7,316 |
| – Cost of teacher regulatory services per teacher | $109 | $132 |
| Service 4: Support to the School Curriculum and Standards Authority | ||
| – Cost per student of support to the School Curriculum and Standards Authority | $75 | $73 |
(a) Targets for 2019–20 are as reported in the 2019–20 State Budget.
Year in dollars
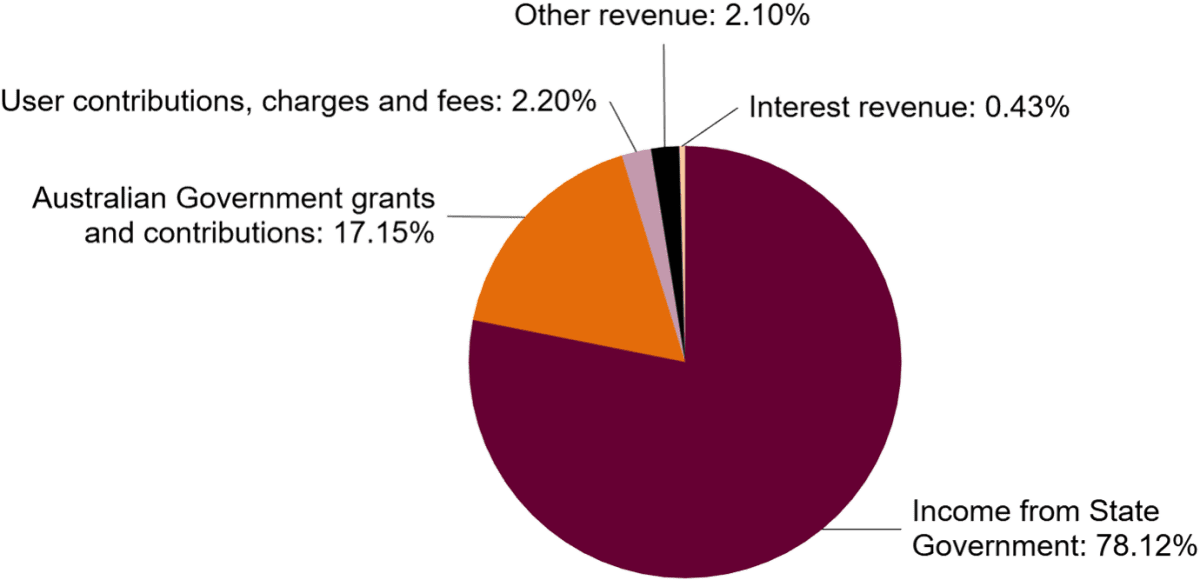
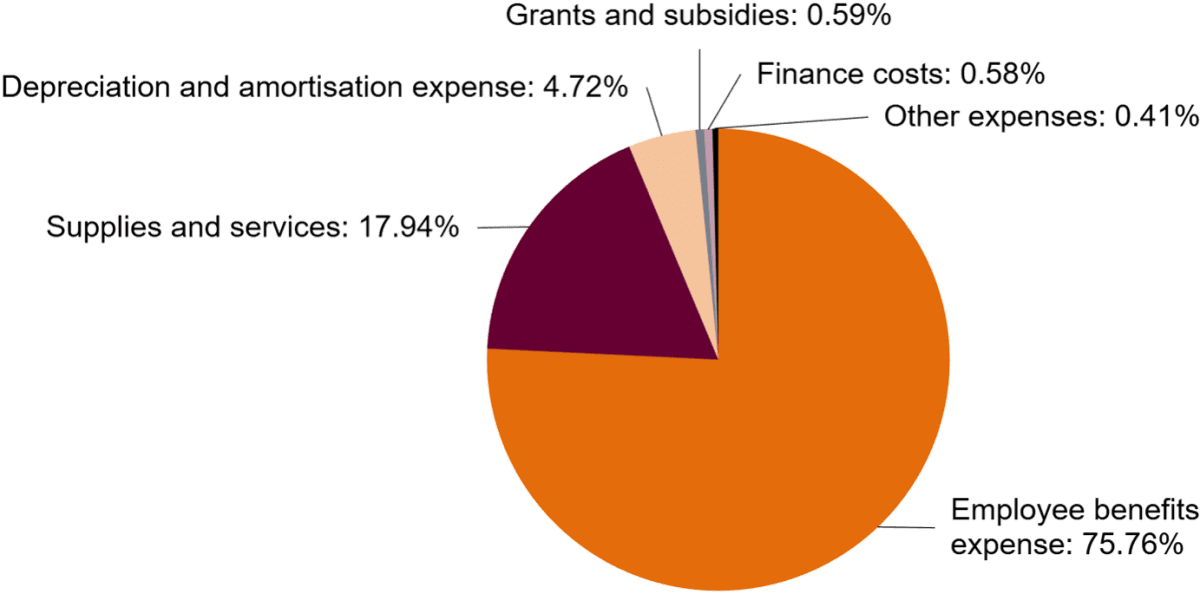
The total cost of providing our services in 2019–20 was $5.4 billion. Figures 1 and 2 summarise sources of revenue and cost of services. Full details of financial performance during 2019–20 are in the Financial statements.
Our results in 2019–20 against agreed financial targets (based on Budget Statements and the Resource Agreement) are in Table 1.
| 2019–20 budget ($’000) | 2019–20 actual ($’000) | Actual vs budget ($’000) | |
|---|---|---|---|
| Total cost of services | 5,241,086 | 5,359,117 | 118,031 |
| Net cost of services | 4,083,009 | 4,204,573 | 121,564 |
| Total equity | 14,490,715 | 13,935,220 | (555,495) |
| Net increase/(decrease) in cash held | (16,318) | (33,016) | (16,698) |
| 2019–20 budget (FTE)(b) | 2019–20 actual (FTE) | Actual vs budget (FTE) | |
| Staff | 39,591 | 40,011 | 420 |
(a) Results in brackets indicate a negative value.
(b) Full-time equivalent.
The variance of $118.0 million (2.3%) between the actual and the budget total cost of services was mainly due to:
- increased maintenance expenditure following the post budget announcement of the High Priority Maintenance and Minor Works program in September 2019
- additional depreciation expenditure associated with the impairment of various buildings damaged due to unforeseen events such as fire and the accelerated depreciation of assets that were disposed of during the year
- an increase in leave liability expense due to a decrease in the discount rate for long service leave liabilities and the combined impact of an increase in leave accruing over the year and less leave being taken during the year due to employees deferring their leave in light of the COVID-19 travel restrictions.
Actual employee benefits expense was higher than the forecast budget due to schools allocating more of their one-line budgets to staffing and the additional staffing costs associated with implementing enhanced cleaning regimes across all of the Department’s properties in response to the COVID-19 pandemic. This increase in expenditure was offset by a similar reduction in supplies and services expenses during 2019–20 and as a result the net impact on the total cost of services was minimal.
The increased maintenance, depreciation and leave expenditure outlined above also contributed to the $121.6 million (3.0%) variance in the net cost of services.
The $555.5 million variance in total equity was mainly due to the lower than expected value of property, plant and equipment ($468.4 million) in 2018–19. The revaluation decrement occurred after the 2019–20 budget estimate was finalised.
The 2019–20 average FTE of 40,011 was 420 FTE (1.1%) higher than the 2019–20 budget estimate due to schools allocating more of their one-line budgets to staffing and the Department’s response to COVID‑19 which resulted in additional staffing resources being allocated to improve the cleaning undertaken across all of the Department’s properties. Since 2015, funding for schools has been delivered through a one-line budget. This provides flexibility to determine how budgets are used to deliver the education programs and support their students, including staffing decisions, which are made at the local school level.