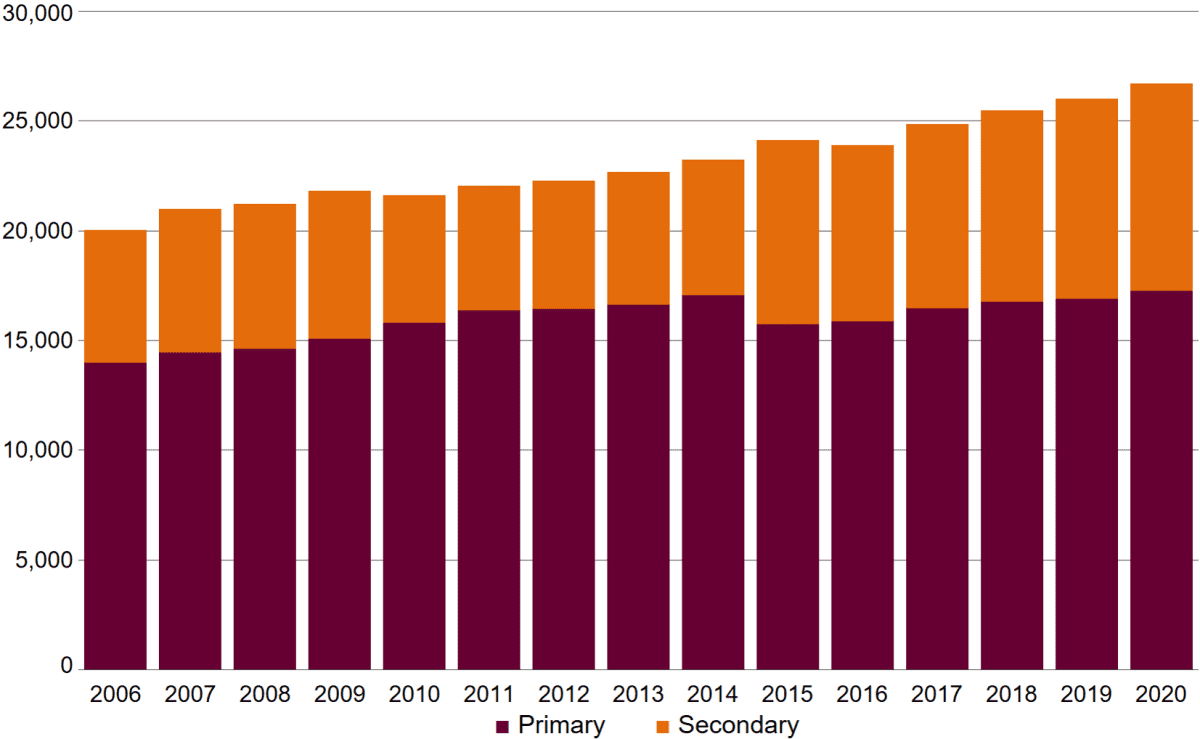
‘Primary’ denotes Kindergarten to Year 6 and ‘Secondary’ spans Years 7 to 12 unless specified otherwise.
Table A1: Students at Western Australian schools by sector 2006 to 2020(a)(b)
| Year | Public schools | Non-government schools | Total |
|---|---|---|---|
| 2006 | 252,061 | 119,896 | 371,957 |
| 2007 | 253,209 | 123,216 | 376,425 |
| 2008 | 253,838 | 127,248 | 381,086 |
| 2009 | 258,132 | 131,240 | 389,372 |
| 2010 | 258,115 | 134,335 | 392,450 |
| 2011 | 261,013 | 137,372 | 398,385 |
| 2012 | 268,129 | 140,006 | 408,135 |
| 2013 | 276,275 | 142,883 | 419,158 |
| 2014 | 283,739 | 144,877 | 428,616 |
| 2015 | 292,952 | 148,980 | 441,932 |
| 2016 | 296,377 | 148,545 | 444,922 |
| 2017 | 302,271 | 147,471 | 449,742 |
| 2018 | 307,520 | 147,813 | 455,333 |
| 2019 | 311,199 | 148,836 | 460,035 |
| 2020 | 317,368 | 149,949 | 467,317 |
(a) Semester 1 student census. Primary and full-time secondary students. Public schools include community kindergartens and non-government schools include Independent pre-schools.
(b) Half cohort progressed through school from 2001 to 2014 inclusive, entering secondary education in 2010.
Table A2: Schools and students in Western Australia by sector and subgroup 2020(a)(b)
| Sector | Schools | Students | |||
|---|---|---|---|---|---|
| All | Female | Male | Aboriginal | ||
| Public | 818 | 317,368 | 153,184 | 164,150 | 26,688 |
| Non-government | 311 | 149,949 | 74,883 | 75,066 | 5,190 |
| Total | 1,129 | 467,317 | 228,067 | 239,216 | 31,878 |
(a) Semester 1 student census. Primary and full-time secondary students. Public schools include community kindergartens.
(b) All includes gender category Other.
Table A3: Students at Western Australian schools by year level and sector 2020(a)
| Year level | Public schools | Non-government schools | Total |
|---|---|---|---|
| Pre-kindergarten | – | 1,628 | 1,628 |
| Kindergarten | 25,060 | 8,387 | 33,447 |
| Pre-primary | 25,785 | 8,627 | 34,412 |
| Year 1 | 26,130 | 8,849 | 34,979 |
| Year 2 | 26,197 | 8,953 | 35,150 |
| Year 3 | 25,427 | 9,201 | 34,628 |
| Year 4 | 25,288 | 9,486 | 34,774 |
| Year 5 | 24,777 | 9,837 | 34,614 |
| Year 6 | 24,227 | 10,074 | 34,301 |
| Year 7 | 21,594 | 13,180 | 34,774 |
| Year 8 | 20,854 | 13,566 | 34,420 |
| Year 9 | 19,663 | 12,817 | 32,480 |
| Year 10 | 18,760 | 12,300 | 31,060 |
| Year 11 | 18,288 | 12,074 | 30,362 |
| Year 12 | 15,235 | 10,904 | 26,139 |
| Primary total | 202,891 | 75,042 | 277,933 |
| Secondary total | 114,477 | 74,907 | 189,384 |
| Grand total | 317,368 | 149,949 | 467,317 |
(a) Semester 1 student census. Primary and full-time secondary students. Includes community kindergartens in public schools and Independent pre-schools in non-government schools. Totals include ungraded students.
Table A4: Students at Western Australian public schools by level of education and subgroup 2020(a)(b)
| Level of education | All | Female | Male | Aboriginal |
|---|---|---|---|---|
| Primary | 202,891 | 97,956 | 104,930 | 17,250 |
| Secondary | 114,477 | 55,228 | 59,220 | 9,438 |
| Total | 317,368 | 153,184 | 164,150 | 26,688 |
(a) Semester 1 student census. Primary and full-time secondary students. Includes community kindergartens.
(b) All includes gender category Other.
Table A5: Western Australian public schools and students by school type and level of education 2020(a)
| School type | Schools | Students | ||
|---|---|---|---|---|
| Primary | Secondary | Total | ||
| Community kindergarten | 18 | 538 | 0 | 538 |
| Primary(b) | 563 | 189,670 | 516 | 190,186 |
| District high | 53 | 7,384 | 3,946 | 11,330 |
| Kindergarten–Year 12(c) | 6 | 2,033 | 2,007 | 4,040 |
| Secondary | 112 | 0 | 106,313 | 106,313 |
| Education support(d) | 64 | 3,172 | 1,674 | 4,846 |
| Specialist services(e) | 2 | 94 | 21 | 115 |
| Total | 818 | 202,891 | 114,477 | 317,368 |
(a) Semester 1 student census. Primary and full-time secondary students.
(b) Includes schools of the air and remote community schools.
(c) Includes School of Isolated and Distance Education.
(d) Includes language development school/centres.
(e) Comprises School of Special Educational Needs: Behaviour and Engagement and School of Special Educational Needs: Sensory.
Table A6: Students at Western Australian public schools by year level 2016 to 2020(a)
| Year level | 2016 | 2017 | 2018 | 2019 | 2020 |
|---|---|---|---|---|---|
| Kindergarten | 23,877 | 24,543 | 24,644 | 24,397 | 25,060 |
| Pre-primary | 25,171 | 25,174 | 25,953 | 25,839 | 25,785 |
| Year 1 | 25,171 | 25,465 | 25,444 | 26,075 | 26,130 |
| Year 2 | 24,859 | 25,102 | 25,425 | 25,417 | 26,197 |
| Year 3 | 25,261 | 24,853 | 25,064 | 25,344 | 25,427 |
| Year 4 | 24,647 | 25,172 | 24,708 | 24,985 | 25,288 |
| Year 5 | 22,797 | 24,301 | 24,775 | 24,351 | 24,777 |
| Year 6 | 21,639 | 22,737 | 24,132 | 24,644 | 24,227 |
| Year 7 | 17,783 | 18,673 | 19,679 | 20,824 | 21,594 |
| Year 8 | 17,469 | 17,970 | 18,762 | 19,612 | 20,854 |
| Year 9 | 17,326 | 17,582 | 18,057 | 18,702 | 19,663 |
| Year 10 | 17,451 | 17,462 | 17,576 | 17,923 | 18,760 |
| Year 11 | 18,187 | 18,088 | 17,954 | 17,839 | 18,288 |
| Year 12 | 14,660 | 15,075 | 15,278 | 15,159 | 15,235 |
| Primary total | 193,422 | 197,347 | 200,145 | 201,052 | 202,891 |
| Secondary total | 102,955 | 104,924 | 107,375 | 110,147 | 114,477 |
| Grand total | 296,377 | 302,271 | 307,520 | 311,199 | 317,368 |
(a) Semester 1 student census. Primary and full-time secondary students. Includes community kindergartens. Totals include ungraded students.
Table A7: Proportion (%) of students by geolocation of Western Australian public schools by level of education 2020(a)(b)
| Geolocation(c) | Primary | Secondary | All |
|---|---|---|---|
| Metropolitan | 76.8 | 75.8 | 76.4 |
| Inner regional | 8.5 | 9.5 | 8.9 |
| Outer regional | 7.1 | 8.2 | 7.5 |
| Remote | 4.7 | 4.1 | 4.5 |
| Very remote | 2.9 | 2.4 | 2.7 |
(a) Semester 1 student census. Primary and full-time secondary students. Includes community kindergartens.
(b) Percentages may not add to 100% due to rounding.
(c) Australian Bureau of Statistics Australian Statistical Geography Standard, based on location of students’ schools.
Table A8: Western Australian public schools and students by education region and level of education 2020(a)
| Education region | Schools | Students | ||
|---|---|---|---|---|
| Primary | Secondary | Total | ||
| Metropolitan | ||||
| North Metropolitan | 248 | 74,744 | 40,910 | 115,654 |
| South Metropolitan | 264 | 83,842 | 46,557 | 130,399 |
| Total | 512 | 158,586 | 87,467 | 246,053 |
| Country(b) | ||||
| Goldfields | 38 | 5,198 | 2,704 | 7,902 |
| Kimberley | 23 | 3,560 | 2,025 | 5,585 |
| Midwest | 47 | 5,102 | 2,843 | 7,945 |
| Pilbara | 29 | 6,720 | 2,946 | 9,666 |
| Southwest | 100 | 18,187 | 13,036 | 31,223 |
| Wheatbelt | 69 | 5,538 | 3,456 | 8,994 |
| Total | 306 | 44,305 | 27,010 | 71,315 |
| Grand total | 818 | 202,891 | 114,477 | 317,368 |
(a) Semester 1 student census. Primary and full-time secondary students. Includes community kindergartens.
(b) Defined as all non-metropolitan education regions.
Figure A1: Aboriginal students at Western Australian public schools by level of education 2006 to 2020(a)(b)(c)
(a) Semester 1 student census. Primary and full-time secondary students. Includes community kindergartens.
(b) Year 7 included in secondary from 2015. Prior to this Year 7 included in primary.
(c) Half cohort progressed through school from 2001 to 2014 inclusive, entering secondary education in 2010.
Table A9: Aboriginal students at Western Australian public schools by year level 2016 to 2020(a)
| Year level | 2016 | 2017 | 2018 | 2019 | 2020 |
|---|---|---|---|---|---|
| Kindergarten | 1,714 | 1,854 | 1,860 | 1,800 | 1,897 |
| Pre-primary | 2,027 | 2,020 | 2,115 | 2,137 | 2,151 |
| Year 1 | 2,025 | 2,123 | 2,108 | 2,181 | 2,234 |
| Year 2 | 2,076 | 2,073 | 2,160 | 2,139 | 2,240 |
| Year 3 | 2,065 | 2,134 | 2,074 | 2,192 | 2,173 |
| Year 4 | 2,089 | 2,095 | 2,141 | 2,125 | 2,218 |
| Year 5 | 1,989 | 2,129 | 2,128 | 2,169 | 2,129 |
| Year 6 | 1,872 | 2,032 | 2,156 | 2,144 | 2,208 |
| Year 7 | 1,534 | 1,714 | 1,856 | 1,975 | 1,979 |
| Year 8 | 1,619 | 1,584 | 1,726 | 1,858 | 1,958 |
| Year 9 | 1,544 | 1,570 | 1,530 | 1,637 | 1,789 |
| Year 10 | 1,375 | 1,457 | 1,464 | 1,390 | 1,549 |
| Year 11 | 1,228 | 1,262 | 1,301 | 1,362 | 1,245 |
| Year 12 | 736 | 816 | 852 | 893 | 918 |
| Primary total | 15,857 | 16,460 | 16,742 | 16,887 | 17,250 |
| Secondary total | 8,036 | 8,403 | 8,729 | 9,115 | 9,438 |
| Grand total | 23,893 | 24,863 | 25,471 | 26,002 | 26,688 |
(a) Semester 1 student census. Primary and full-time secondary students. Includes community kindergartens. Totals include ungraded students.
Table A10: Aboriginal students at Western Australian public schools by education region 2020(a)
| Education region | Aboriginal | All | Aboriginal students as % of all public school students |
|---|---|---|---|
| Metropolitan | |||
| North Metropolitan | 5,062 | 115,654 | 4.4 |
| South Metropolitan | 7,542 | 130,399 | 5.8 |
| Total | 12,604 | 246,053 | 5.1 |
| Country(b) | |||
| Goldfields | 1,800 | 7,902 | 22.8 |
| Kimberley | 3,417 | 5,585 | 61.2 |
| Midwest | 2,324 | 7,945 | 29.3 |
| Pilbara | 2,730 | 9,666 | 28.2 |
| Southwest | 2,322 | 31,223 | 7.4 |
| Wheatbelt | 1,491 | 8,994 | 16.6 |
| Total | 14,084 | 71,315 | 19.7 |
| Grand total | 26,688 | 317,368 | 8.4 |
(a) Semester 1 student census. Primary and full-time secondary students. Includes community kindergartens.
(b) Defined as all non-metropolitan education regions.
Table A11: Students registered to receive home education 2016 to 2020(a)(b)
| 2016 | 2017 | 2018 | 2019 | 2020 |
|---|---|---|---|---|
| 3,303 | 3,464 | 3,563 | 3,720 | 4,116 |
(a) Under the School Education Act 1999, the Department is responsible for regulation of home education, including evaluation of home education programs and educational progress of students.
(b) As at end of March.
Table A12: Western Australian non-government schools and students by school type and level of education 2020(a)(b)
| School type | Schools | Students | ||
|---|---|---|---|---|
| Primary | Secondary | Total | ||
| Primary | 147 | 39,518 | 0 | 39,518 |
| Primary–secondary | 120 | 35,524 | 48,031 | 83,555 |
| Secondary | 44 | 0 | 26,876 | 26,876 |
| Total | 311 | 75,042 | 74,907 | 149,949 |
(a) Semester 1 student census. Primary and full-time secondary students.
(b) Primary includes pre-kindergarten students at non-government schools.
Table A13: Non‑government schools and students by religious affiliation of school 2019 and 2020(a)
| Religious affiliation | Schools | Students | ||
|---|---|---|---|---|
| 2019 | 2020 | 2019 | 2020 | |
| No religious affiliation | 52 | 53 | 7,175 | 7,476 |
| Total religious affiliation | 257 | 258 | 141,661 | 142,473 |
| Anglican | 19 | 19 | 22,104 | 22,069 |
| Baptist | 15 | 15 | 10,199 | 10,791 |
| Catholic | 164 | 164 | 78,617 | 78,521 |
| Seventh Day Adventist | 5 | 5 | 701 | 717 |
| Uniting Church | 8 | 8 | 8,826 | 8,459 |
| Various other | 46 | 47 | 21,214 | 21,916 |
| Grand total | 309 | 311 | 148,836 | 149,949 |
(a) Semester 1 student census. Primary and full-time secondary students.
Table A14: Students at Western Australian residential colleges 2011 to 2020(a)
| College | 2011 | 2012 | 2013 | 2014 | 2015 | 2016 | 2017 | 2018 | 2019 | 2020 |
|---|---|---|---|---|---|---|---|---|---|---|
| Albany | 95 | 97 | 80 | 81 | 86 | 94 | 82 | 69 | 66 | 67 |
| Broome | 52 | 77 | 51 | 72 | 73 | 72 | 102 | 99 | 81 | 75 |
| City Beach | 66 | 69 | 60 | 57 | 54 | 56 | 52 | 54 | 56 | 45 |
| Esperance | 78 | 86 | 75 | 73 | 82 | 79 | 95 | 87 | 83 | 80 |
| Geraldton | 100 | 89 | 89 | 62 | 60 | 80 | 68 | 55 | 62 | 49 |
| Merredin | 24 | 44 | 47 | 48 | 59 | 60 | 41 | 37 | 37 | 37 |
| Moora | 29 | 40 | 30 | 28 | 34 | 35 | 32 | 26 | 26 | 37 |
| Narrogin | 156 | 142 | 133 | 124 | 125 | 113 | 102 | 92 | 93 | 83 |
| Northam | 37 | 21 | 19 | 18 | 21 | 24 | 19 | 13 | 9 | 14 |
| Total | 637 | 665 | 584 | 563 | 594 | 613 | 593 | 532 | 513 | 487 |
(a) Semester 1 student census.