‘Primary’ denotes Kindergarten to Year 6 and ‘Secondary’ spans Years 7 to 12 unless specified otherwise.
Figure A9: Organisational chart at 30 June 2020
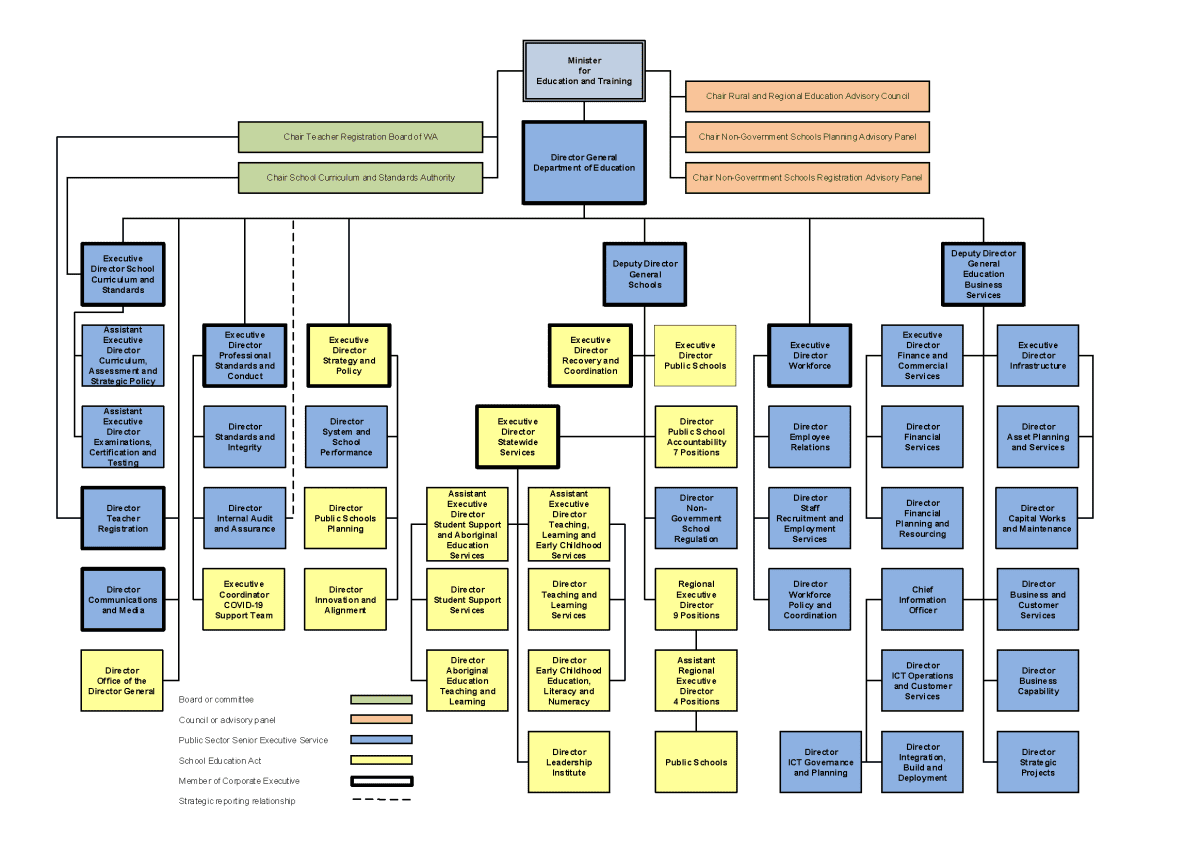
Table A25: School-based teaching staff(a) by education category(b) and gender 2020
| Education category | Female | Male | Total numbers | ||
|---|---|---|---|---|---|
| N | % | N | % | ||
| Primary | 9,998 | 84.4 | 1,849 | 15.6 | 11,847 |
| Secondary | 5,031 | 61.0 | 3,212 | 39.0 | 8,243 |
| Education support | 704 | 84.4 | 130 | 15.6 | 834 |
| Total | 15,733 | 75.2 | 5,191 | 24.8 | 20,924 |
(a) Full-time equivalents at Semester 1 student census including teachers at community kindergartens. Based on counting method used for National Schools Statistics Collection that does not include staff on extended leave.
(b) Staff apportioned to education category based on proportion of students in each education category, and apportioned and rounded to be consistent with figures presented in Table 16.
Table A26: Teacher retirements and resignations 2015 to 2019
| 2015 | 2016 | 2017 | 2018 | 2019 | |
|---|---|---|---|---|---|
| Retirement | 539 | 542 | 566 | 550 | 556 |
| Resignation | 582 | 622 | 597 | 586 | 604 |