During 2019–20, an average of 40,011 full-time equivalent (FTE) staff were employed. Of these, 58.2% were teachers, 29.9% were support staff, 6.9% were cleaners and gardeners, and 5.0% were administrative and clerical staff. School‑based staff represented 96.5% of total FTE.
Click here for a snapshot of our workforce demographics, and see tables 13 to 16 and figures 3 and 4 for further information about our staff.
Our average FTE is an increase of 806 FTE (2.1%) from 2018–19. This growth can be attributed to student enrolments, an increase in education assistants in accordance with an election commitment and the response to COVID‑19 which allocated extra staffing resources to undertake additional cleaning across Department sites.
The implementation of the State Government election commitments to fund 300 FTE education assistants and 50 FTE Aboriginal and Islander education officers to directly support students is on track. As at 30 June 2020, funding had been allocated to 200 schools with the most socially disadvantaged students for the employment of an additional 242.16 FTE education assistants. Also, an additional 37.8 FTE Aboriginal and Islander education officers were employed across 68 regional senior high schools, district high schools and remote community schools; with a further 7.0 FTE used to employ Aboriginal Boarding Supervisors at four residential colleges. All staff were employed on a permanent basis.
Since the Public Sector Commissioner’s Instruction regarding the conversion and appointment of fixed term contract and casual employees to permanency was released in August 2018, we have continued to review and oversee the employment arrangements of our fixed term and casual staff. We are committed to permanency being the preferred form of employment.
Both teacher retirements and resignations remained relatively stable in 2019 (see Appendix 4).
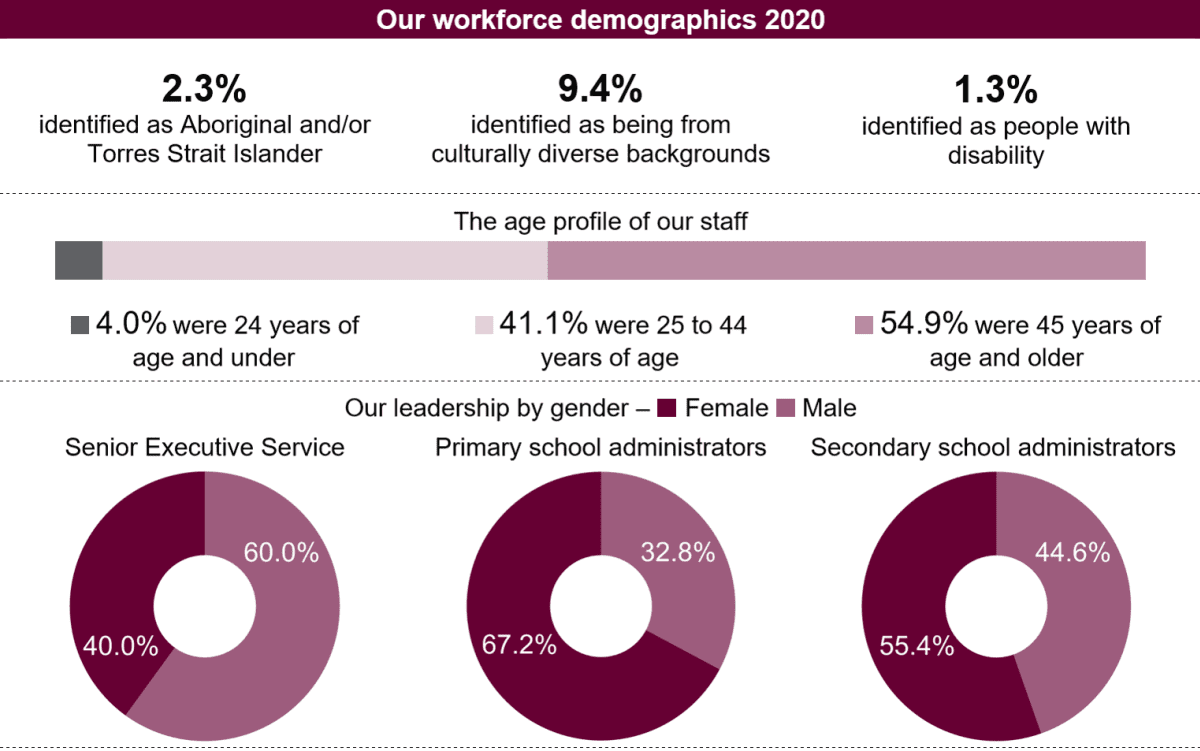
| Demographics(a) | 2019 (%) | 2020 (%) |
|---|---|---|
| Aboriginal and/or Torres Strait Islander | 2.4 | 2.3 |
| People from a culturally diverse background | 8.9 | 9.4 |
| People with disability | 1.3 | 1.3 |
| Age profile | ||
| People 24 years of age and under | 4.0 | 4.0 |
| People 25 to 44 years of age | 40.9 | 41.1 |
| People 45 years of age and over | 55.1 | 54.9 |
| Gender breakdown of Senior Executive Service(b) | ||
| Female Male | 34.6 65.4 | 40.0 60.0 |
| Gender breakdown of school administrators(c) | ||
| Primary Female Male | 65.9 34.1 | 67.2 32.8 |
| Secondary Female Male | 54.1 45.9 | 55.4 44.6 |
(a) Data as at June of each year.
(b) Employees who are members of the Senior Executive Service (SES) under sections 53 and 56 of the Public Sector Management Act 1994.
(c) Defined as Level 3 to 6 under The School Education Act Employees’ (Teachers and Administrators) General Agreement 2019.
Table 13: Staff(a) by category 2015–16 to 2019–20
| Category | 2015–16 | 2016–17 | 2017–18(b) | 2018–19 | 2019–20 |
|---|---|---|---|---|---|
| Teaching(c) | 21,862 | 22,889 | 22,878 | 23,031 | 23,303 |
| Support(d) | 10,390 | 11,127 | 11,447 | 11,674 | 11,944 |
| Cleaning and gardening | 2,479 | 2,541 | 2,573 | 2,593 | 2,763 |
| Administrative and clerical(e) | 1,673 | 1,741 | 1,938 | 1,907 | 2,001 |
| Total | 36,404 | 38,298 | 38,836 | 39,205 | 40,011 |
(a) Average financial year paid full-time equivalent staff rounded to nearest whole number.
(b) From 2017–18, the new Department of Education was formed which included staff from School Curriculum and Standards Authority and former Department of Education, Department of Education Services, and Country High School Hostels Authority.
(c) Includes principals and deputy principals.
(d) Includes school clerical staff and education assistants.
(e) Public Sector Management Act 1994 positions and teaching award staff in administrative roles.
Table 14: Staff(a) by operational area and category 2019–20
| Operational area | Teaching(b) | Support(c) | Cleaning and gardening | Administrative and clerical(d) | Total |
|---|---|---|---|---|---|
| Schools | 23,263 | 11,942 | 2,758 | 661 | 38,624 |
| Central strategic and corporate services | – | – | – | 1,243 | 1,243 |
| Regional offices | 40(e) | 2 | 5 | 97 | 144 |
| Total | 23,303 | 11,944 | 2,763 | 2,001 | 40,011 |
(a) Average financial year paid full-time equivalent staff rounded to nearest whole number.
(b) Includes principals and deputy principals.
(c) Includes school clerical staff and education assistants.
(d) Public Sector Management Act 1994 positions and teaching award staff in administrative roles.
(e) Includes Primary Extension and Challenge (PEAC) teachers and home education moderators.
Table 15: School-related staff(a) by type of school and category 2019–20
| Type of school | Teaching(b) | Support(c) | Cleaning and gardening | Administrative and clerical(d) | Total |
|---|---|---|---|---|---|
| Community kindergarten | 19 | 18 | – | – | 37 |
| Primary(e) | 12,240 | 6,490 | 1,460 | 12 | 20,202 |
| District high | 1,009 | 545 | 167 | 5 | 1,726 |
| Kindergarten–Year 12(f) | 413 | 158 | 43 | 37 | 651 |
| Secondary | 7,968 | 2,673 | 1,049 | 526 | 12,216 |
| Education support(g) | 888 | 1,865 | 32 | 44 | 2,829 |
| Specialist services(h) | 726 | 193 | 7 | 37 | 963 |
| Total | 23,263 | 11,942 | 2,758 | 661 | 38,624 |
(a) Average financial year paid full-time equivalent staff rounded to nearest whole number.
(b) Includes principals and deputy principals.
(c) Includes school clerical staff and education assistants.
(d) Public Sector Management Act 1994 positions and teaching award staff in administrative roles.
(e) Includes schools of the air and remote community schools.
(f) Includes School of Isolated and Distance Education.
(g) Includes language development school/centres.
(h) Includes education services that do not directly enrol students such as camp schools, some schools of special educational needs, vacation swimming and Instrumental Music School Services. Residential colleges are included under Support.
Table 16: School-based teaching staff(a) by category and education category(b) 2020
| Category | Primary | Secondary | Education support | Total |
|---|---|---|---|---|
| Principal | 563 | 171 | 66 | 800 |
| Deputy principal | 820 | 399 | 70 | 1,289 |
| Head of department or program coordinator | 10 | 975 | 7 | 992 |
| Teacher | 10,274 | 6,575 | 661 | 17,510 |
| Guidance/counselling | 180 | 123 | 30 | 333 |
| Total | 11,847 | 8,243 | 834 | 20,924 |
(a) Full-time equivalents at Semester 1 student census including teachers at community kindergartens. Based on counting method used for National Schools Statistics Collection that does not include staff on extended leave.
(b) Staff apportioned to education category based on proportion of students in each education category.
Figure 3: School-based teaching staff (a) by education category (b) and gender 2020 (c)
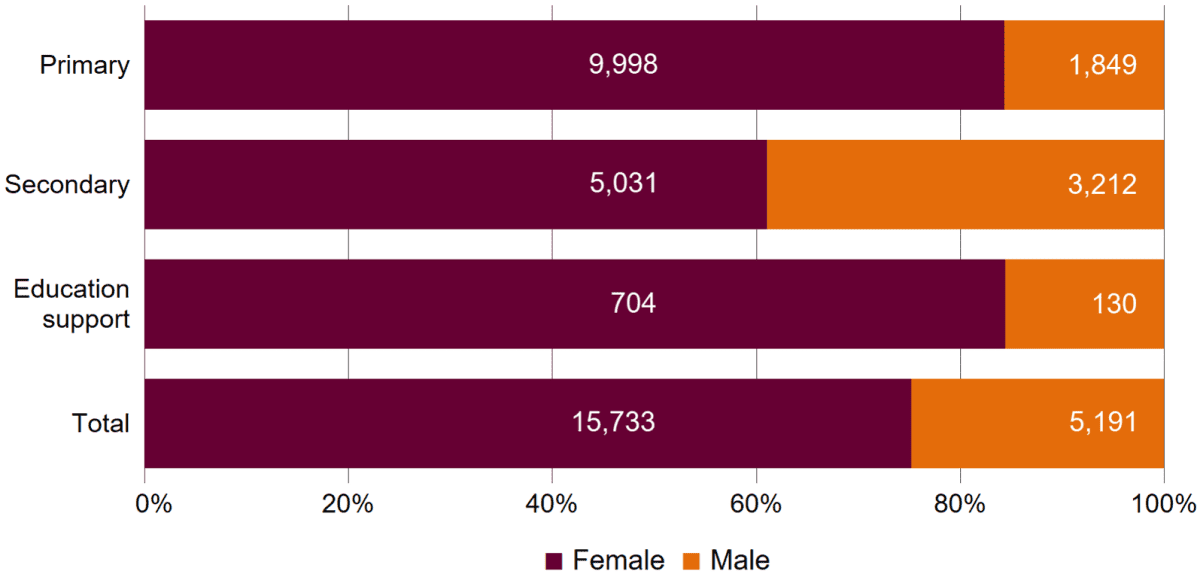
(a) Full-time equivalents at Semester 1 student census including teachers at community kindergartens. Based on counting method used for National Schools Statistics Collection that does not include staff on extended leave.
(b) Staff apportioned to education category based on proportion of students in each education category.
(c) See Appendix 4 for corresponding table.
Figure 4: Student-teacher ratios (a) 2015 to 2019
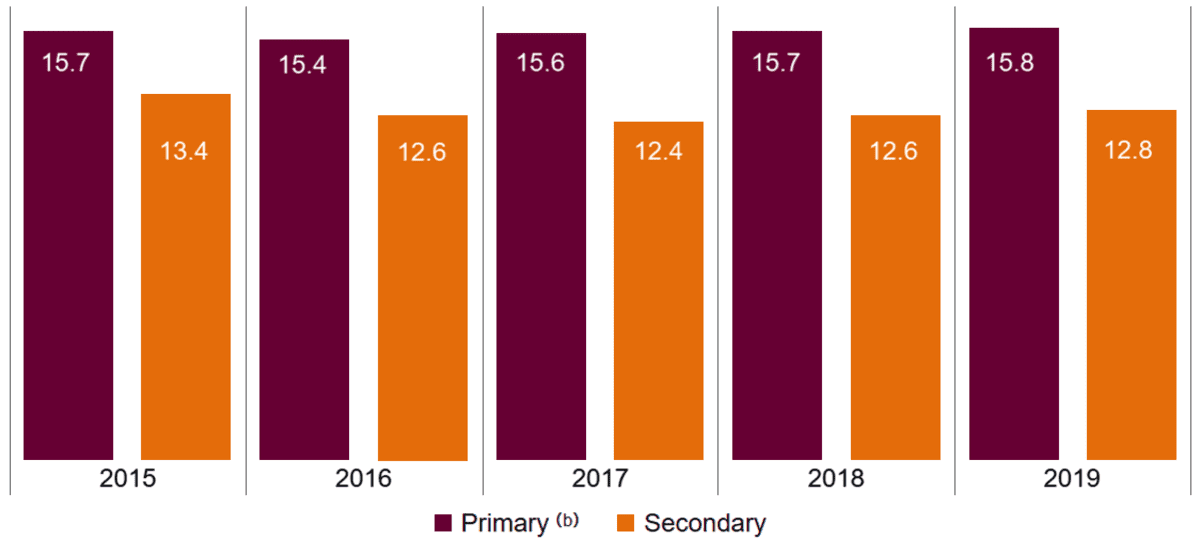
(a) Ratios based on full-time equivalent students and full-time equivalent teaching staff at Semester 2.
(b) Excludes Kindergarten.