Figure A2: Percentage of Western Australian public school students achieving standards in NAPLAN Reading by year level, 2008 to 2019(a)
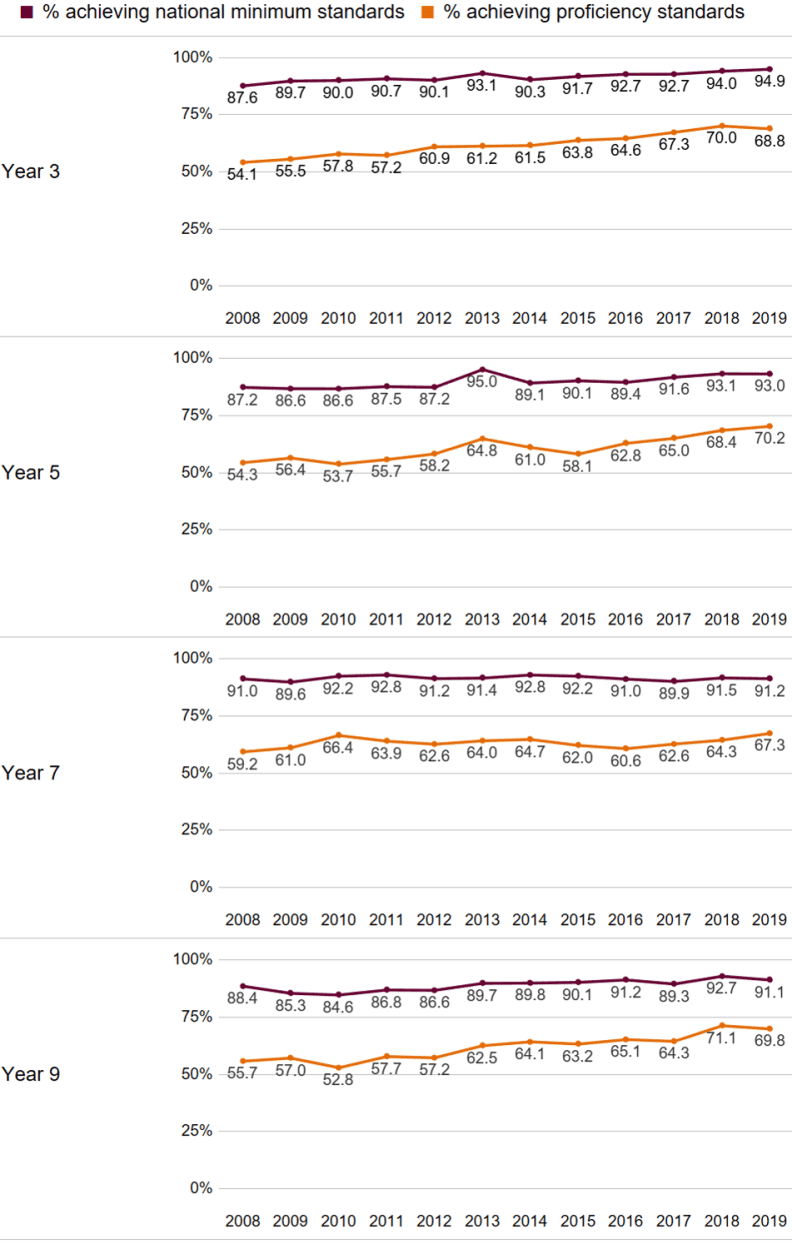
(a) Year 7 became part of public school secondary education in Western Australia from 2015, having previously been part of primary education.
Figure A3: Percentage of Western Australian public school students achieving standards in NAPLAN Numeracy by year level, 2008 to 2019(a)
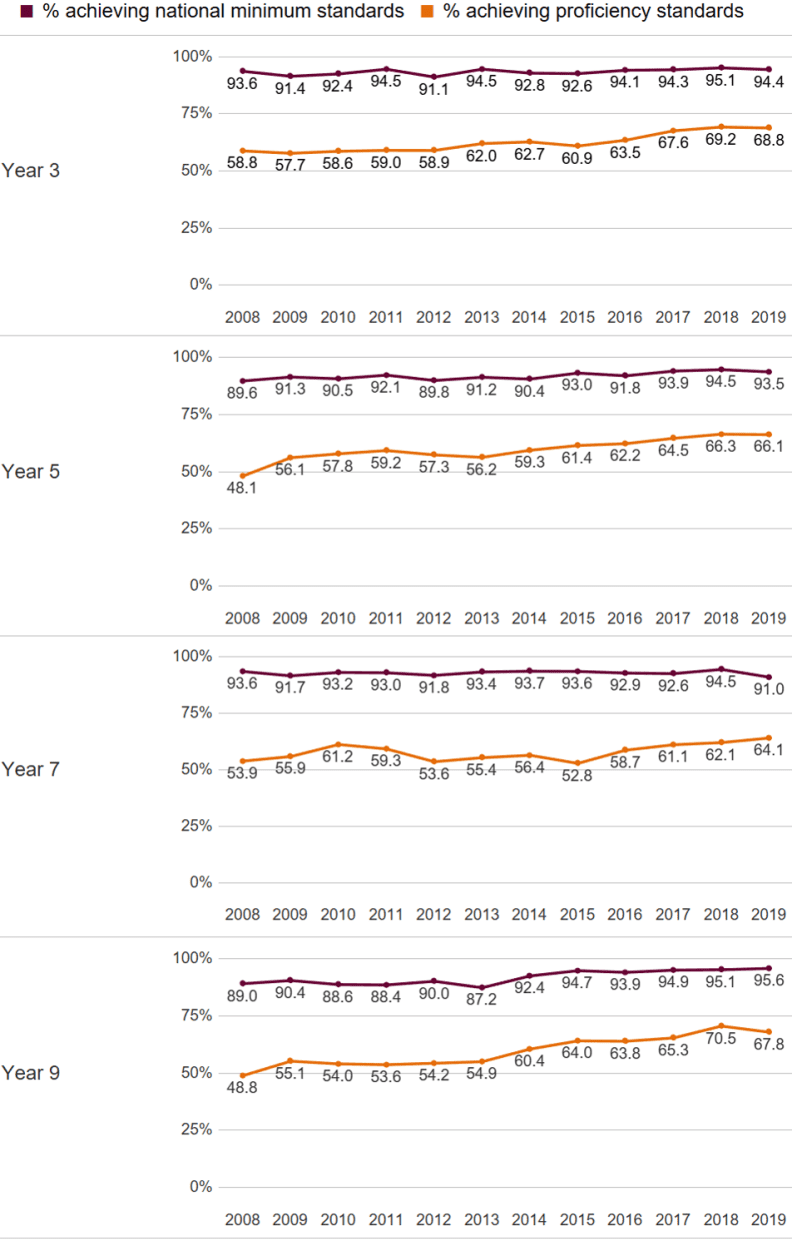
(a) Year 7 became part of public school secondary education in Western Australia from 2015, having previously been part of primary education.
Table A15: Percentage of Western Australian public school students achieving the national minimum standards in NAPLAN by year level 2019
| Assessment | Year 3 | Year 5 | Year 7 | Year 9 |
|---|---|---|---|---|
| Reading | 94.9 | 93.0 | 91.2 | 91.1 |
| Writing | 95.6 | 90.7 | 85.9 | 81.2 |
| Numeracy | 94.4 | 93.5 | 91.0 | 95.6 |
Figure A4: Mean NAPLAN Reading scores of Western Australian public school students by year level 2008 to 2019(a)
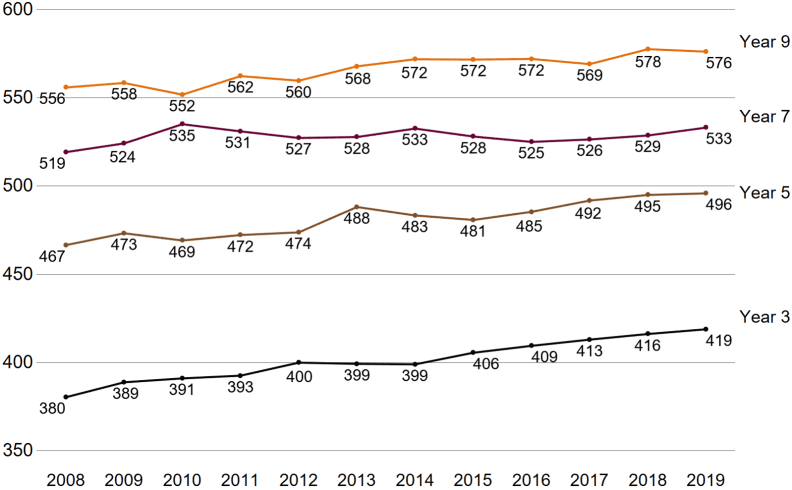
(a) Year 7 became part of public school secondary education in Western Australia from 2015, having previously been part of primary education.
Figure A5: Mean NAPLAN Numeracy scores of Western Australian public school students by year level 2008 to 2019(a)
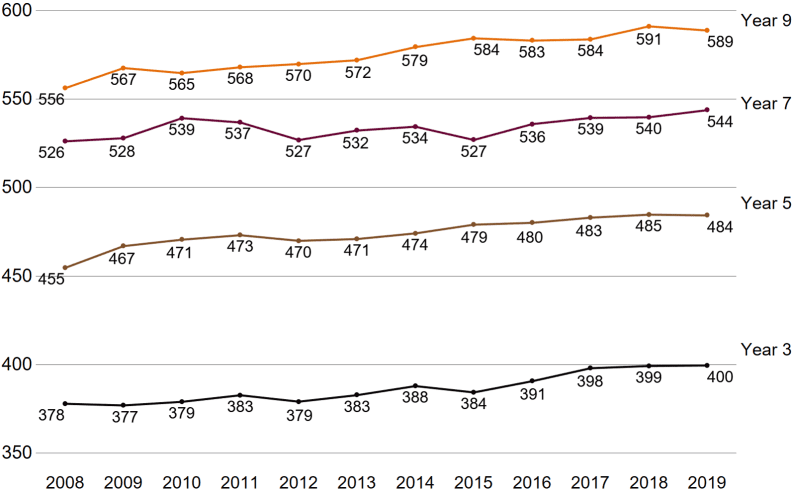
(a) Year 7 became part of public school secondary education in Western Australia from 2015, having previously been part of primary education.
Table A16: Percentage of children in care achieving the national minimum standards 2017 and 2019(a)
| Assessment | 2017 | 2019 | ||
|---|---|---|---|---|
| Year level | % | Year level | % | |
| Reading | Year 3 Year 5 Year 7 | 81.4 77.8 67.8 | Year 5 Year 7 Year 9 | 79.2 74.1 71.1 |
| Numeracy | Year 3 Year 5 Year 7 | 86.6 80.1 87.1 | Year 5 Year 7 Year 9 | 84.4 73.9 91.8 |
(a) Only includes students with results in 2017 and 2019.