Executive summary - 2
Year in dollars
The total cost of providing our services in 2022–23 was $6.3 billion. Figures 1 and 2 summarise sources of revenue and cost of services. For full details of financial performance during 2022–23, refer to Financial statements.
Figure 1: Revenue sources 2022–23
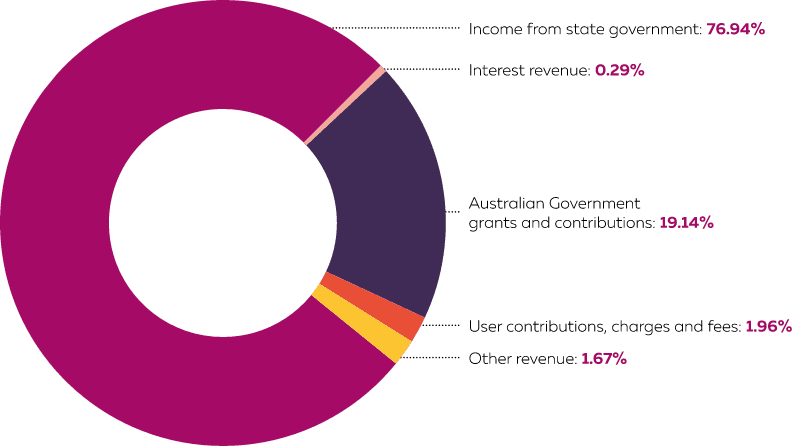
Source: Education Business Services
Figure 2: Costs 2022–23
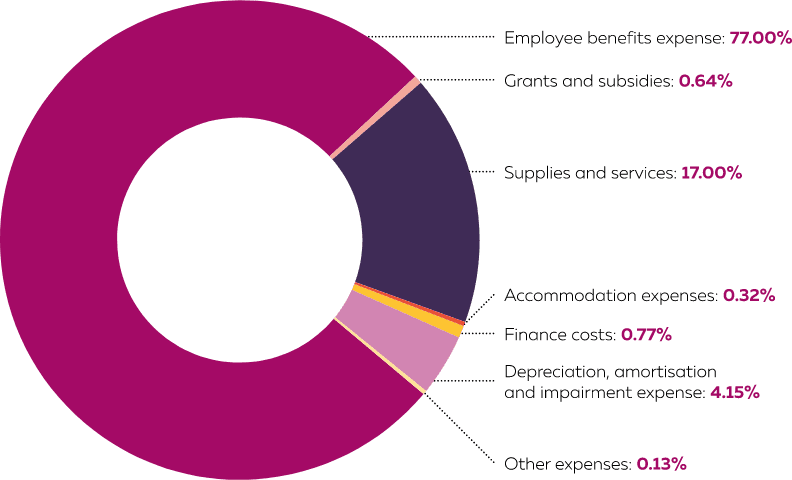
Source: Education Business Services
Our results in 2022–23 against agreed financial targets (based on Budget Statements and the Resource Agreement) are in Table 2.
Table 2: Budget targets compared to actual results 2022–23(a)
| 2022–23 Target(b) $m | 2022–23 Estimated Actual(c) $m | 2022–23 Actual $m | Variation Actual versus Estimated Actual | Variation Actual versus Target | |||
|---|---|---|---|---|---|---|---|
| $m | %(d) | $m | %(d) | ||||
| Total cost of services (expense limit) No material variance | 5,892.8 | 6,294.8 | 6,310.9 | 16.1 | 0.3 | 418.1 | 7.1 |
| Net cost of services No material variance | 4,446.1 | 4,827.6 | 4,833.4 | 5.8 | 0.1 | 387.3 | 8.7 |
| Total equity Variance primarily due to the $2.05 billion increase in the valuation of land, land improvements and buildings following a comprehensive revaluation of these assets in 2022–23. | 18,968.5 | 17,429.5 | 19,478.1 | 2,048.6 | 11.8 | 509.6 | 2.7 |
| Agreed salary expense level No material variance | 4,011.0 | 4,345.3 | 4,301.0 | (44.3) | (1.0) | 290.0 | 7.2 |
| Agreed executive salary expense level(e) No material variance | 5.9 | 5.9 | 5.9 | (0.0) | (0.6) | 0.0 | 0.0 |
| Agreed borrowing limit No material variance | 414.6 | 406.1 | 398.0 | (8.1) | (2.0) | (16.6) | (4.0) |
| Agreed limit(f) $m | 2022–23 Target(c)/Actual $m | Variation $m | |||||
| Agreed working cash limit (at Budget) | 285.4 | 285.4 | - | ||||
| Agreed working cash limit (at Actual) The Department’s working cash actual was within its working cash limit at 30 June 2023. | 308.1 | 306.0 | (2.1) | ||||
(a) Results in brackets indicate a negative value.
(b) Original budget as specified in the 2022–23 Budget Statements.
(c) Final adjusted 2022–23 budget (2022–23 Estimated Actual) as specified in the 2023–24 Budget Statements.
(d) Material variances are defined as +/‑ 10% of the respective financial target. Further explanations are also contained in Note 10.1 ‘Explanatory statement for controlled operations’ to the financial statements and in the ‘Spending Changes’ of the 2023–24 Budget Statements – Budget Paper 2 (Volume 1, pages 349–350).
(e) The 2022–23 target of $5.88 million in the Department’s resource agreement was revised to $5.92 million to reflect the impact of salaries increases payable under the state government’s wages policy. The Department operated within this revised target in 2022–23.
(f) As specified in the Department’s original 2022–23 resource agreement.
Source: Education Business Services