Year at a glance in 2023
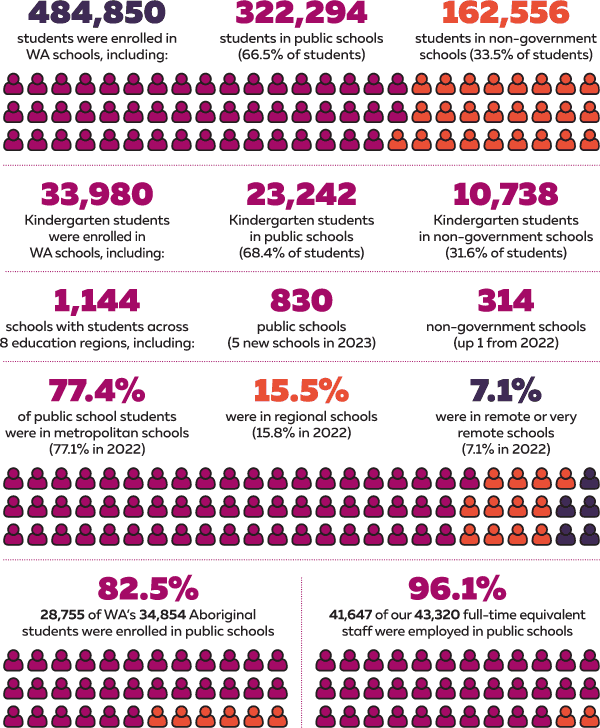
Public schools include community kindergartens and non‑government schools include pre‑Kindergarten students.
For further enrolment data, refer to Appendix 1. For further workforce data, refer to Staff.
Year scorecard
We supported our state government goal of ‘Safe, strong and fair communities: Supporting our local and regional communities to thrive’ through our desired outcome ‘School students across Western Australia have access to high quality education’.
Key performance indicators helped us assess and monitor the extent to which we achieved this outcome and enhanced our ability to account to the community for our performance. Our results in 2022–23 against agreed targets are in Table 1.
Table 1: Key performance indicators, summary of performance against the targets in the 2022–23 Budget Papers
| Effectiveness indicators | Target(a) | Result |
|---|---|---|
| Rate of participation in education (proportion of persons aged 15 to 17 years in some form of education) | 100% | 94.0% |
| Retention in public schooling (proportion of Year 7 public school cohort studying in Year 12) | 82% | 75.7% |
| Western Australian Certificate of Education (WACE) achievement rate by Year 12 public school students | 82% | 80.7% |
| Year 3 public school students achieving proficiency in: | ||
| – Reading – Numeracy | 69% 66% | 69.4% 64.2% |
| Year 5 public school students achieving proficiency in: | ||
| – Reading – Numeracy | 72% 67% | 72.0% 65.0% |
| Year 7 public school students achieving proficiency in: | ||
| – Reading – Numeracy | 65% 62% | 66.9% 60.8% |
| Year 9 public school students achieving proficiency in: | ||
| – Reading – Numeracy | 70% 71% | 67.9% 68.3% |
| Efficiency indicators | Target(a) | Result |
|---|---|---|
| Service 1: Public primary education | ||
| – Cost per student full-time equivalents | $17,499 | $18,778 |
| Service 2: Public secondary education | ||
| – Cost per student full-time equivalents | $20,319 | $21,778 |
| Service 3: Regulation and non-government sector assistance | ||
| – Cost of non-government school regulatory services per non‑government school | $7,660 | $6,132 |
| – Cost of teacher regulatory services per teacher | $110 | $89 |
| Service 4: Support to the School Curriculum and Standards Authority | ||
| – Cost per student of support to the School Curriculum and Standards Authority | $84 | $81 |
(a) Targets for 2022–23 are as reported in the 2022–23 Budget Papers.
Source: Education Business Services, and System and School Performance
For further information, refer to Key performance indicators.
Year in dollars
The total cost of providing our services in 2022–23 was $6.3 billion. Figures 1 and 2 summarise sources of revenue and cost of services. For full details of financial performance during 2022–23, refer to Financial statements.
Figure 1: Revenue sources 2022–23
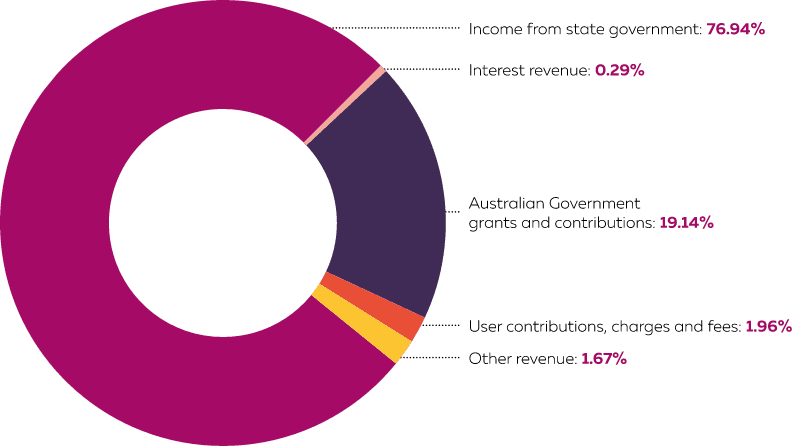
Source: Education Business Services
Figure 2: Costs 2022–23
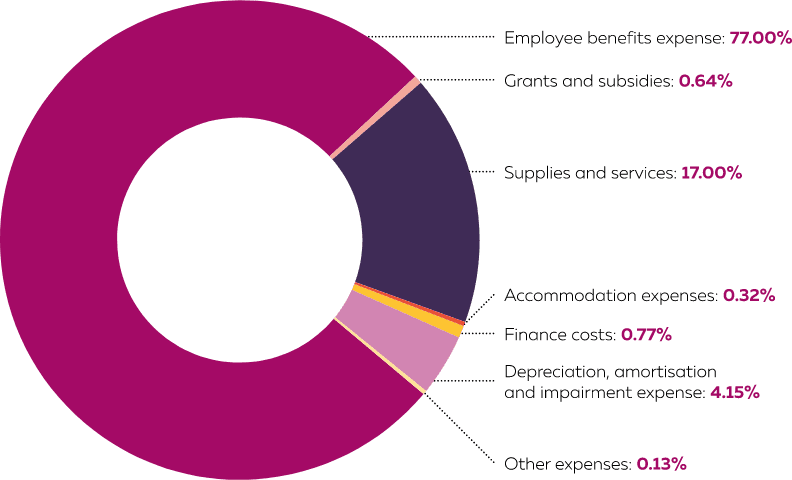
Source: Education Business Services
Our results in 2022–23 against agreed financial targets (based on Budget Statements and the Resource Agreement) are in Table 2.
Table 2: Budget targets compared to actual results 2022–23(a)
| 2022–23 Target(b) $m | 2022–23 Estimated Actual(c) $m | 2022–23 Actual $m | Variation Actual versus Estimated Actual | Variation Actual versus Target | |||
|---|---|---|---|---|---|---|---|
| $m | %(d) | $m | %(d) | ||||
| Total cost of services (expense limit) No material variance | 5,892.8 | 6,294.8 | 6,310.9 | 16.1 | 0.3 | 418.1 | 7.1 |
| Net cost of services No material variance | 4,446.1 | 4,827.6 | 4,833.4 | 5.8 | 0.1 | 387.3 | 8.7 |
| Total equity Variance primarily due to the $2.05 billion increase in the valuation of land, land improvements and buildings following a comprehensive revaluation of these assets in 2022–23. | 18,968.5 | 17,429.5 | 19,478.1 | 2,048.6 | 11.8 | 509.6 | 2.7 |
| Agreed salary expense level No material variance | 4,011.0 | 4,345.3 | 4,301.0 | (44.3) | (1.0) | 290.0 | 7.2 |
| Agreed executive salary expense level(e) No material variance | 5.9 | 5.9 | 5.9 | (0.0) | (0.6) | 0.0 | 0.0 |
| Agreed borrowing limit No material variance | 414.6 | 406.1 | 398.0 | (8.1) | (2.0) | (16.6) | (4.0) |
| Agreed limit(f) $m | 2022–23 Target(c)/Actual $m | Variation $m | |||||
| Agreed working cash limit (at Budget) | 285.4 | 285.4 | - | ||||
| Agreed working cash limit (at Actual) The Department’s working cash actual was within its working cash limit at 30 June 2023. | 308.1 | 306.0 | (2.1) | ||||
(a) Results in brackets indicate a negative value.
(b) Original budget as specified in the 2022–23 Budget Statements.
(c) Final adjusted 2022–23 budget (2022–23 Estimated Actual) as specified in the 2023–24 Budget Statements.
(d) Material variances are defined as +/‑ 10% of the respective financial target. Further explanations are also contained in Note 10.1 ‘Explanatory statement for controlled operations’ to the financial statements and in the ‘Spending Changes’ of the 2023–24 Budget Statements – Budget Paper 2 (Volume 1, pages 349–350).
(e) The 2022–23 target of $5.88 million in the Department’s resource agreement was revised to $5.92 million to reflect the impact of salaries increases payable under the state government’s wages policy. The Department operated within this revised target in 2022–23.
(f) As specified in the Department’s original 2022–23 resource agreement.
Source: Education Business Services