‘Primary’ denotes Kindergarten to Year 6 and ‘Secondary’ spans Years 7 to 12 unless specified otherwise.
Figure A6: Participation rate (%) of persons aged 15 to 17 years engaged in some form of education by gender 2018 to 2022(a)(b)(c)

(a) Based on Australian Bureau of Statistics preliminary estimates of resident population (age at 30 June) and data collected from public and non‑government schools (Semester 2 student census, age at 1 July), universities (age at 30 June), and vocational education and training providers (age at 30 June).
(b) University enrolment data for 2022 is an estimate based on 2021 university enrolment data and an annual compound growth factor calculated from university enrolment data across the previous 4 years.
(c) Revised figures for 2018 to 2021 due to updated data for 2021 university enrolments and estimates of resident population in 2018 to 2021.
Source: System and School Performance, using data from the Australian Bureau of Statistics, Department of Training and Workforce Development and the Australian Government Department of Education
Table A16: Public school student attendance rate (%) by level of education and subgroup 2022(a)(b)
| Level of education | Aboriginal | All |
|---|---|---|
| All | 64.6 | 84.4 |
| Primary(c) | 69.6 | 86.7 |
| Secondary | 56.6 | 80.8 |
(a) Excludes Kindergarten students, Canning College students and international students.
(b) As per National Standards for Student Attendance Data Reporting.
(c) Pre‑primary to Year 6.
Source: System and School Performance
Table A17: Percentage of public school students by attendance category by subgroup 2022(a)(b)(c)
| Attendance category | Aboriginal | All |
|---|---|---|
| Regular attendance (90–100%) | 16.8 | 46.6 |
| Indicated attendance risk (80–<90%) | 21.6 | 30.7 |
| Moderate attendance risk (60–<80%) | 25.9 | 14.9 |
| Severe attendance risk (<60%) | 35.7 | 7.8 |
(a) Excludes Kindergarten students, Canning College students and international students.
(b) Percentages may not add to 100% due to rounding.
(c) As per National Standards for Student Attendance Data Reporting.
Source: System and School Performance
Figure A7: Percentage of public school students by subgroup by attendance category 2018 to 2022(a)(b)(c)

(a) Excludes Kindergarten students, Canning College students and international students.
(b) As per National Standards for Student Attendance Data Reporting.
(c) 2020 data excludes Weeks 7 to 10, Term 1 due to disruptions caused by COVID‑19.
Source: System and School Performance
Table A18: Apparent secondary retention rate (%) of public school students by subgroup 2018 to 2022(a)(b)(c)(d)
| Subgroup | 2018 | 2019 | 2020 | 2021 | 2022 | |||||
|---|---|---|---|---|---|---|---|---|---|---|
| % | N | % | N | % | N | % | N | % | N | |
| All | 81.4 | 13,925 | 81.6 | 14,041 | 81.5 | 14,189 | 80.4 | 14,329 | 75.7 | 14,140 |
| Female | 84.3 | 6,874 | 85.7 | 7,118 | 84.9 | 7,154 | 83.9 | 7,167 | 79.5 | 7,114 |
| Male | 78.7 | 7,051 | 77.8 | 6,923 | 78.2 | 7,030 | 77.0 | 7,145 | 72.0 | 6,999 |
| Aboriginal | 47.3 | 718 | 47.6 | 768 | 46.9 | 783 | 47.5 | 750 | 47.9 | 825 |
| Female | 47.3 | 355 | 48.4 | 397 | 46.7 | 382 | 49.5 | 381 | 47.4 | 405 |
| Male | 47.3 | 363 | 46.8 | 371 | 47.1 | 401 | 45.6 | 369 | 48.2 | 419 |
(a) Excludes Canning College and Tuart College students, part‑time and international students, and mature‑aged students at senior campuses.
(b) All includes gender category ‘Other’.
(c) Calculated using the number of students in the Semester 2 student census. ‘N’ is the number of Year 12 students.
(d) Prior to 2020, the apparent retention rate is from Year 8 to Year 12. From 2020, the apparent retention rate is from Year 7 to Year 12. This change is because the 2020 Year 12 cohort was the first cohort to commence secondary school in Year 7.
Source: System and School Performance
Figure A8: Apparent secondary retention rate (%) of public school students by subgroup 2018 to 2022(a)(b)(c)(d)
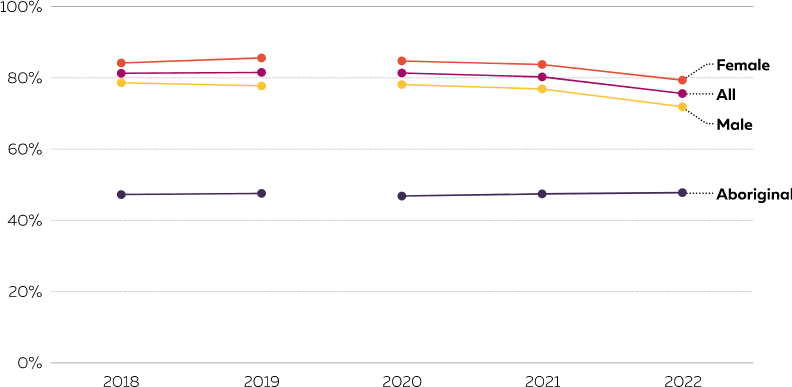
(a) Excludes Canning College and Tuart College students, part‑time and international students, and mature‑aged students at senior campuses.
(b) All includes gender category ‘Other’.
(c) Calculated using the number of students in the Semester 2 student census.
(d) Prior to 2020, the apparent retention rate is from Year 8 to Year 12. From 2020, the apparent retention rate is from Year 7 to Year 12. This change is because the 2020 Year 12 cohort was the first cohort to commence secondary school in Year 7.
Source: System and School Performance
Table A19: Year 12 public school student WACE achievement rate by subgroup 2021 and 2022(a)
| Subgroup | 2021 | 2022 | |||
|---|---|---|---|---|---|
| % | N | % | N | ||
| WACE achievement rate(b) | All Aboriginal | 81.1 42.7 | 11,856 320 | 80.7 41.5 | 11,591 342 |
(a) ‘N’ is the number of students who achieved the outcome. Only includes students counted in the rate’s denominator.
(b) Percentage of Year 12 full‑time students in the Semester 2 student census who achieved WACE. For details on criteria required to achieve a WACE, refer to our WACE achievement key performance indicator.
Source: System and School Performance
Table A20: Year 12 public school student ATAR achievement by subgroup 2021 and 2022(a)(b)
| 2021 | 2022 | ||||||
|---|---|---|---|---|---|---|---|
| Subgroup | Students | Median ATAR | Students | Median ATAR | |||
| % | N | % | N | ||||
| Students who achieved an ATAR(c) | All Aboriginal | 33.2 6.0 | 4,890 45 | 80.25 56.35 | 30.6 5.8 | 4,422 48 | 81.90 68.90 |
| ATAR students who achieved at least 55(d) | All Aboriginal | 86.7 57.8 | 4,238 26 | – – | 87.0 62.5 | 3,846 30 | – – |
(a) Figures are ‘actuals’. Reports prior to 2020–21 presented ‘apparent’ achievement figures.
(b) ‘N’ is the number of students who achieved the outcome. Only includes students counted in the rate’s denominator.
(c) Percentages use the number of Year 12 students in the Semester 2 student census as the denominator.
(d) Percentages use the number of Year 12 students in the Semester 2 student census who achieved an ATAR as the denominator.
Source: System and School Performance
Table A21: Year 12 public student VET certificate II or higher achievement by subgroup 2021 and 2022(a)(b)
| 2021 | 2022 | |||||
|---|---|---|---|---|---|---|
| Subgroup | Students | Total VET certificates II or higher | Students | Total VET certificates II or higher | ||
| %(c) | N | %(c) | N | |||
| All | 58.4 | 8,588 | 12,539 | 56.3 | 8,128 | 12,044 |
| Aboriginal | 51.1 | 384 | 530 | 47.2 | 390 | 545 |
(a) Figures are ‘actuals’. Reports prior to 2020–21 presented ‘apparent’ achievement figures.
(b) ‘N’ is the number of students who achieved a VET certificate II or higher achievement. Only includes students counted in the rate’s denominator.
(c) The number of Year 12 students in the Semester 2 student census is the denominator.
Source: System and School Performance
Table A22: WACE achievement rate (%) of Year 12 public school students by subgroup 2018 to 2022(a)(b)(c)
| Subgroup | 2018(d) | 2019 | 2020 | 2021 | 2022 |
|---|---|---|---|---|---|
| All | 80.5 | 80.7 | 81.7 | 81.1 | 80.7 |
| Male | 77.9 | 78.1 | 80.1 | 79.9 | 78.8 |
| Female | 83.2 | 83.2 | 83.3 | 82.4(e) | 82.5 |
| Aboriginal | 47.7 | 46.9(f) | 46.2 | 42.7 | 41.5 |
(a) Year 12 full‑time students in the Semester 2 student census.
(b) All includes gender category ‘Other’.
(c) Year 12 WACE achievement data from the School Curriculum and Standards Authority and taken at a point in time. Data may be updated after this time for a variety of reasons such as students successfully appealing their results.
(d) A few registered training organisations did not complete VET certification for some public school students in time to be included in the 2018 data. This may have affected the data reported for 2018.
(e) Revised, previously reported as 82.3.
(f) Revised, previously reported as 46.7.
Source: System and School Performance
Table A23: Satisfaction of Year 12 public school students by subgroup 2018 to 2022(a)(b)
| Subgroup | 2018 | 2019 | 2020 | 2021 | 2022(c) | |
|---|---|---|---|---|---|---|
| % satisfied with quality of teaching | ||||||
| All | 87.7 | 87.4 | 88.4 | 86.0 | 85.1 | |
| Male | 87.1 | 86.5 | 88.0 | 86.3 | 84.5 | |
| Female | 88.3 | 88.3 | 88.8 | 85.9 | 85.7 | |
| Aboriginal | 89.9 | 86.5 | 88.8 | 89.1 | 86.4 | |
| % satisfied with quality of education facilities | ||||||
| All | 84.8 | 83.3 | 84.2 | 81.3 | 79.4 | |
| Male | 84.7 | 82.5 | 83.6 | 81.6 | 78.4 | |
| Female | 84.9 | 84.1 | 84.6 | 81.0 | 80.3 | |
| Aboriginal | 88.2 | 83.9 | 85.6 | 81.3 | 80.5 | |
(a) Post‑school intentions and satisfaction survey, conducted in Semester 2.
(b) All includes gender category ‘Other’.
(c) Completed by more than 7,900 Year 12 students.
Source: System and School Performance